Products
 Access the Report
Products
Real-Time Data Collection & Quality
Collect customer data, ensure data quality, and send it anywhere.
Real-Time CDP & Predictive Insights
Deliver relevant and trusted experiences based on real-time customer data.
Data Management & Storage
Own and access your most important enterprise asset, your customer data.
Tealium AIStream™
The intelligent real-time customer data stream for your AI.
CloudStream™
Activate customer data directly from your data cloud with zero duplication.
Tealium for Healthcare
Power more privacy-first patient experiences with real-time data.
Tealium Moments
Own the customer experience moment with real-time intelligence and action.
Integrations
Integrations Overview
Turnkey, flexible integrations across your entire marketing technology stack.
Integrations Marketplace
Explore over 1,300 available integrations.
Cloud Data Warehouse Partner Ecosystem
Drive data collection and real-time activation for Cloud Data Warehouses.
Conversion API (CAPI) Integrations
Solutions for signal loss with unique ad platform integrations.
Identity Partner Ecosystem
Integrate and activate identity solutions to create better data-driven experiences.
2025 Gartner® Magic Quadrant™ for Customer Data Platforms
Two Years Running: Tealium Recognized as a Leader
 Access the Report
Solutions
Roles
Use Cases
Growth & Acquisition
Deliver personalized, relevant experiences and optimize ad spend.
Loyalty & Retention
Understand customer behavior early to deliver proactive experiences.
Customer Experience & Personalization
Create great customer experiences with real-time, unified data.
Predictive Insights & Customer Analytics
Deliver real-time experiences across the customer journey.
Data Collection & Privacy
Place privacy and consent at the core to build trusted customer experiences.
Unified Customer Profile
Understand and delight customers by using current and complete data.
Operationalizing Mobile Data
Operationalizing your mobile data across the entire data lifecycle.
Tealium for AI
Power AI initiatives with consented, filtered, and enriched data in real-time.
Partners
 Learn More
Partners
Tealium Partner Network
Comprised of global SIs, consultants, digital agencies, and complementary technology solutions.
Find a Tealium Partner
Tealium works with hundreds of partners around the globe.
Join the Tealium Partner Network
Become a Tealium partner.
Integrations Marketplace
Explore over 1,300 available integrations.
Tealium on AWS Marketplace
Deliver cleaner, connected customer data to AWS to power smarter insights and seamless experiences.
 Learn More
Resources
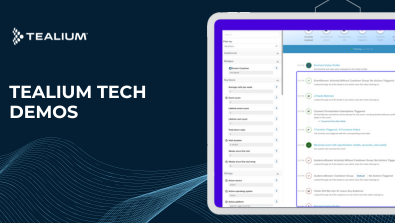
 View Tech Demos
MARKETING & ANALYTICS
Customer Success
Explore Tealium Tech Demos
Experience Tealium in action with self-guided demos and live walkthroughs that show how data flows, activates, and delivers results.
 View Tech Demos
Company
 Learn more
Company
Tealium Signs Strategic Collaboration Agreement with AWS to Accelerate AI-Driven Growth for Customers
Press Release
 Learn more


